In response, regulators have mainly focused on risks related to sustainability and the shift to net-zero when assessing the impact of climate change on the financial markets.
In addition to sustainability reporting, the industry must focus on physical risks that are associated with extreme weather events, such as cyclones, wildfires, earthquakes, heatwaves, flooding and more — all of which indicate long-term climate shifts.
These climate-related physical risks have significant implications, particularly for how sell-side firms understand and manage risks and assets. Sell-side businesses need comprehensive data to enable robust physical risk assessment. Geospatial technology correlates climate and asset data to improve physical risk analysis within the financial system.
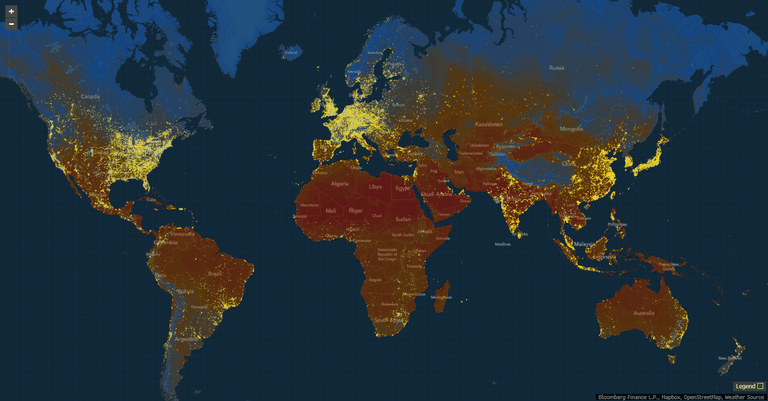
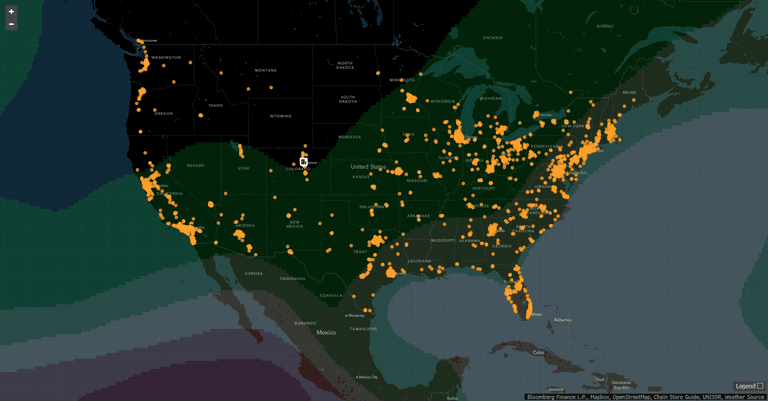
Geospatial data involves anything with a mappable location, whether it’s an address or coordinate. This data can help analysts see areas where there are droughts or flooding, for example. By overlaying this data with information about the locations of company assets, viewers can assess the relationship of weather, climate and extreme events to those asset-level locations.
Take the example of a publicly traded company with a chain of retail stores located in cities where wildfires or hurricanes are increasingly prevalent. That organization faces greater physical — and fiscal — risks. Additionally, a large bank with these assets in its portfolio may also experience an outsized effect of climate-related risk on the institution’s core financial stability.
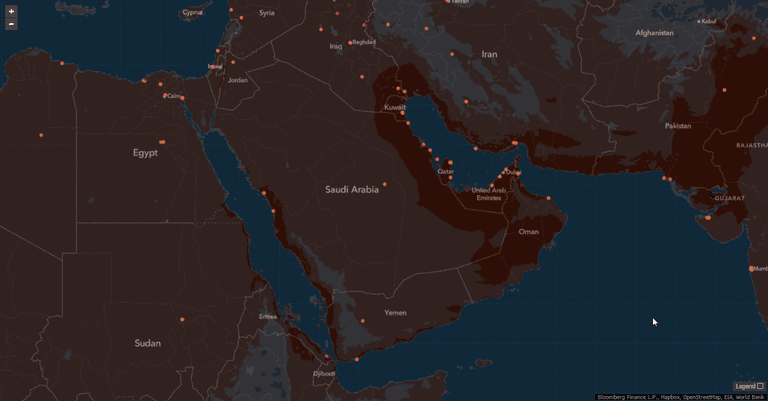
This is the new reality for public companies and sell-side firms. However, when it comes to assessing these emerging risks, the industry still lags behind. Only a few sectors leverage geospatial data to understand physical risks. For example, commodity traders use this data to understand how many oil tankers are at sea at any given point in time to better gauge supply.
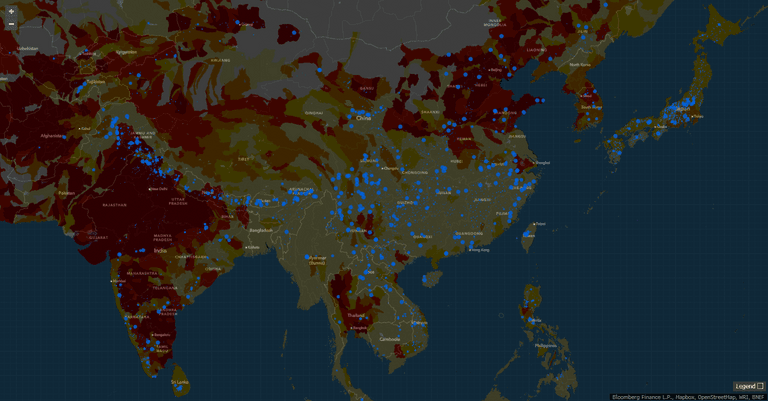
Climate-related risks can lead to a wide range of financial risks for companies, which is why the Bloomberg Terminal integrated physical risk assessment tools like MAP <GO> into our offerings. Our customers can easily build maps upon which they can layer climate, weather, and physical asset data. Other overlays include satellite imagery and live traffic information. Users can search by company or security to understand physical risk, compare multiple companies at the same time, and share these maps and data visualizations across their organizations. Other features include charts, newsfeeds and the ability to export this data into reports.
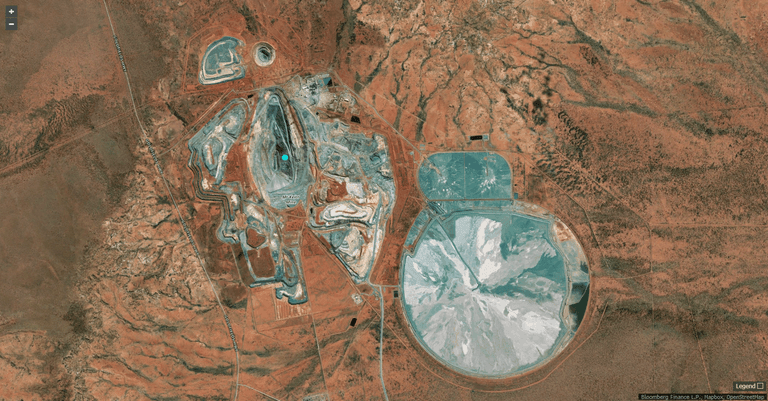
The map is just a picture of the world, but ultimately, it’s the geospatial data that makes the analysis possible. Having a range of data — whether it’s raw power plant, factory and retail store data or data on mines, airports, railroads and dozens of other datasets — allows users to get a comprehensive view of who owns certain assets and the risks that a company may face. Geospatial relationships help analysts generate new ideas and manage risk, leading to smarter investment decisions.
Beyond finding investment opportunities and uncovering physical risk to portfolios, the financial industry is also leveraging geospatial data to meet environmental, social and governance (ESG) reporting regulations. Four jurisdictions now mandate climate-related reporting based on recommendations by the Financial Stability Board’s Task Force on Climate-Related Disclosures (TCFD). Top experts from across the financial sector joined the TCFD — which is chaired by Michael Bloomberg — to create a voluntary framework to help companies disclose climate-related risks and opportunities. Alternative data sources are critical for creating a fuller picture of climate challenges and how to reduce these existential risks. Geospatial data — and automated tools like MAP <GO> that visually present this information — offer an invaluable opportunity for the industry to better understand climate risks and opportunities; effectively address them; and increase the stability of financial markets.
Following the publication of the final recommendations by the TCFD in June 2017, the United Nations Environment Programme Finance Initiative (UNEP FI) began a series of TCFD Pilot Projects for banks, investors, and insurers. It published the report Navigating a New Climate, which focused on the importance of geographic data for physical risk assessment.
“While third-party climate risk mapping tools exist, these often provide insufficient and/or inconsistent granularity to assess the impact of natural events or incremental climate change. Precise longitude and latitude coordinates for assets (e.g., loans, collateral) and for other datasets greatly enhances the accuracy of physical risk analysis,” UNEP FI stated in its report.
Several of the report’s participants — large sell-side firms like Royal Bank of Canada, TD Bank Group and UBS — are already capitalizing on geospatial data to understand their physical risks. Some have built internal location intelligence and data analysis capabilities to assess physical risks in their portfolios. Others use Bloomberg’s physical risk assessment tools to measure the impact of climate-related risks on borrower credit ratings or electric utilities lenders within their portfolios.
Use Bloomberg’s physical risk assessment tools to measure the impact of climate-related risks
Geospatial data offers a lot of promise for not only assessing climate risks but also improving sustainability-related climate disclosures and reporting. However, there are challenges with making full use of this data. Some areas have spotty coverage in which data may be regional rather than global in nature. In other cases there is limited identification data, few publicly available operating metrics, and/or sparse information about who owns certain physical assets. Technology advancements will gradually resolve some of these issues, but in the interim, firms can leverage the data that’s currently available to conduct more robust physical risk assessments.